“Property planning report” means different things depending on who is asking. A conveyancer means a certificate. A planner means zone and overlays. An engineer means levels, flood and rainfall. This post sets out what each section of a site report actually contains, where the data comes from, and when it is worth paying for one rather than collecting it yourself.
The three things people call a planning report
It helps to separate them, because they are not substitutes.
- A planning certificate. A statutory document issued by the council or the state. In New South Wales it is a section 10.7 planning certificate. It is the only one of the three you can rely on legally, and it is the one a contract of sale needs.
- A free government planning report. Victoria publishes a Planning Property Report. Queensland, New South Wales, South Australia and Tasmania publish map viewers that do the same job interactively. These give you the zone and the overlays, free, from the authoritative source.
- A research or site report. A compiled document that pulls the planning layers together with the title, the hazard overlays, the DA history, the levels and the engineering data for one lot, and usually a CAD file. This is the one that saves time rather than providing legal cover.
If you need legal cover, order the certificate. If you need to decide whether a site is worth a fee proposal this afternoon, you need the third kind.
Section by section, and the source behind each
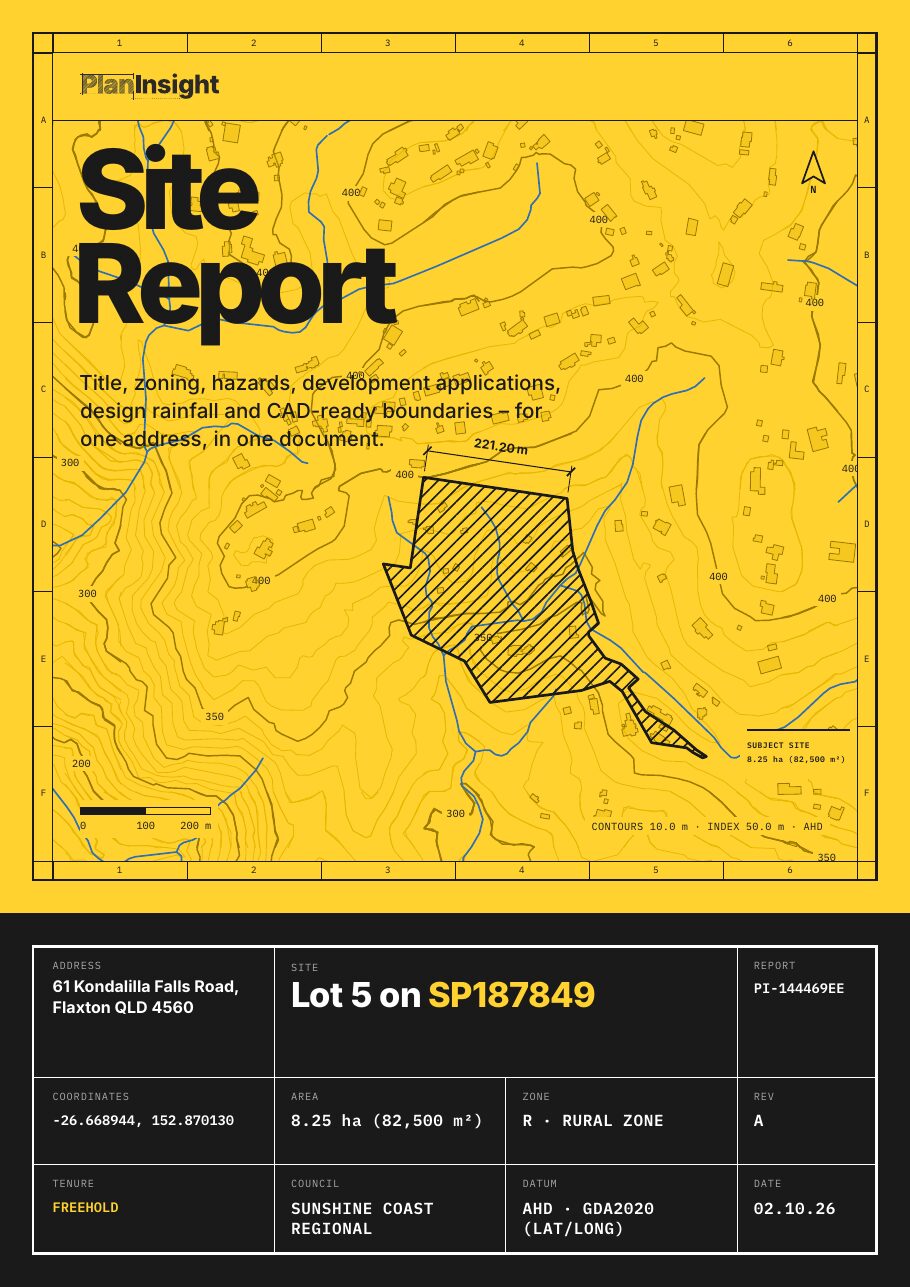
This is the structure of the PlanInsight Site Report, but the list is a reasonable checklist for any site report you are given or asked to produce.
Title details
Lot, plan, area and tenure, from the state titles and cadastre data. This is how the property is identified in every other search you will run, so it belongs on page one. Note that title details are not the same as a title search: the registered dealings, easements and covenants sit on the title itself, so order a title search from your state’s titles office when you need them.
Zoning
The planning zone for the lot, where the council publishes it. Zoning drives everything downstream: permitted uses, height, setbacks, site coverage and in New South Wales the floor space ratio. If you are new to FSR, see understanding floor space ratio.
Hazard overlays
Flood, bushfire, landslide, coastal and acid sulfate overlays that cross the lot, with the share of the lot each one covers. The percentage is a scoping number, not a certificate, but it is the number that tells you whether an overlay clips a corner or sterilises the developable area. See flood overlay map check by address for how each state publishes these.
Development application history
Every DA recorded against the lot, with the council reference, the description, the dates and a link back to the council record.
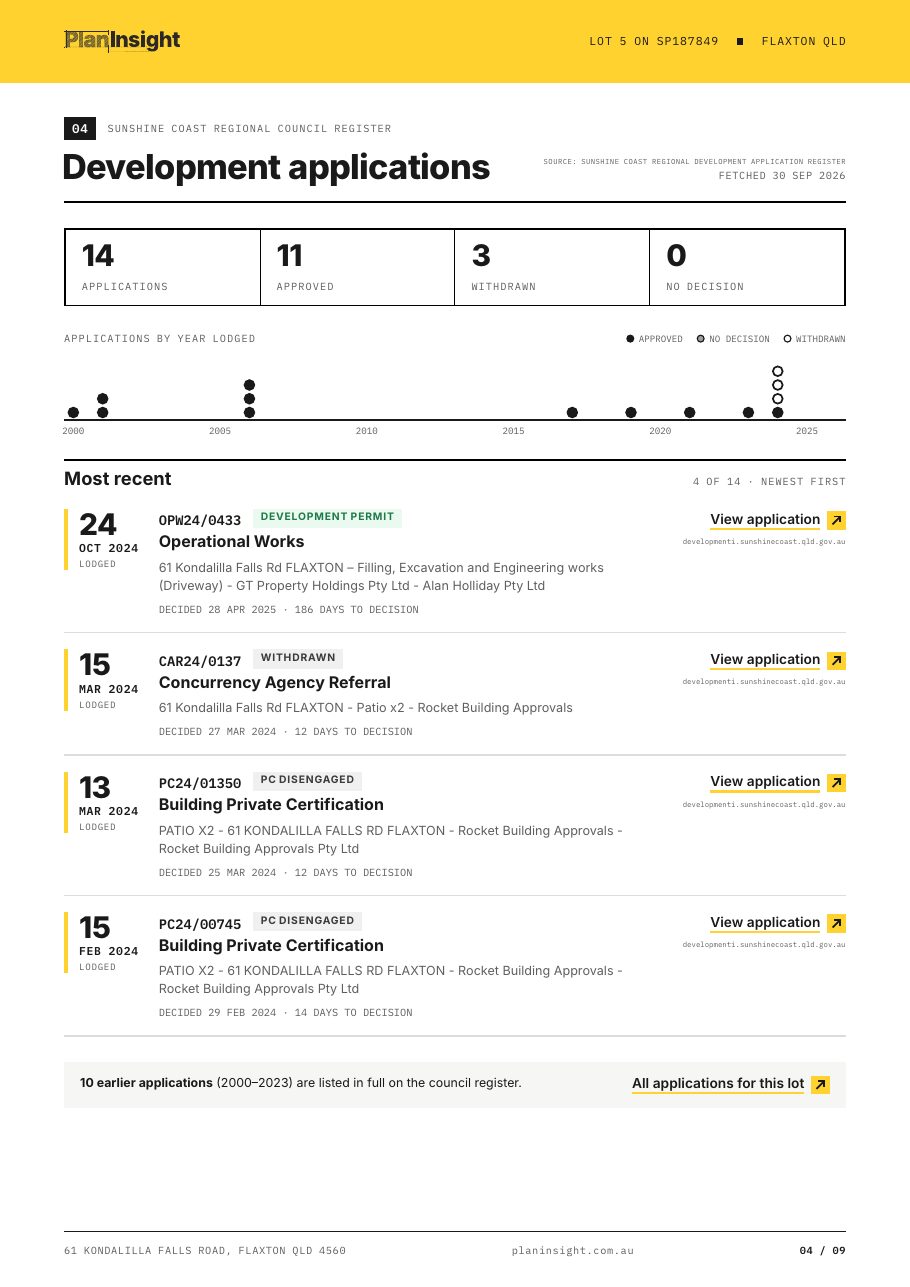
This is the section people underrate. Overlays tell you which permits are triggered. DA history tells you what the council has in fact approved, refused or conditioned on that land. A refusal on the lot two years ago is the single most useful thing you can know before quoting. Each council runs its own register, which is why collecting this by hand is slow: the council DA tracker list shows how many different systems there are.
Design rainfall (IFD)
The Bureau of Meteorology 2016 intensity frequency duration table for the site coordinates, with design values and climate change factors.
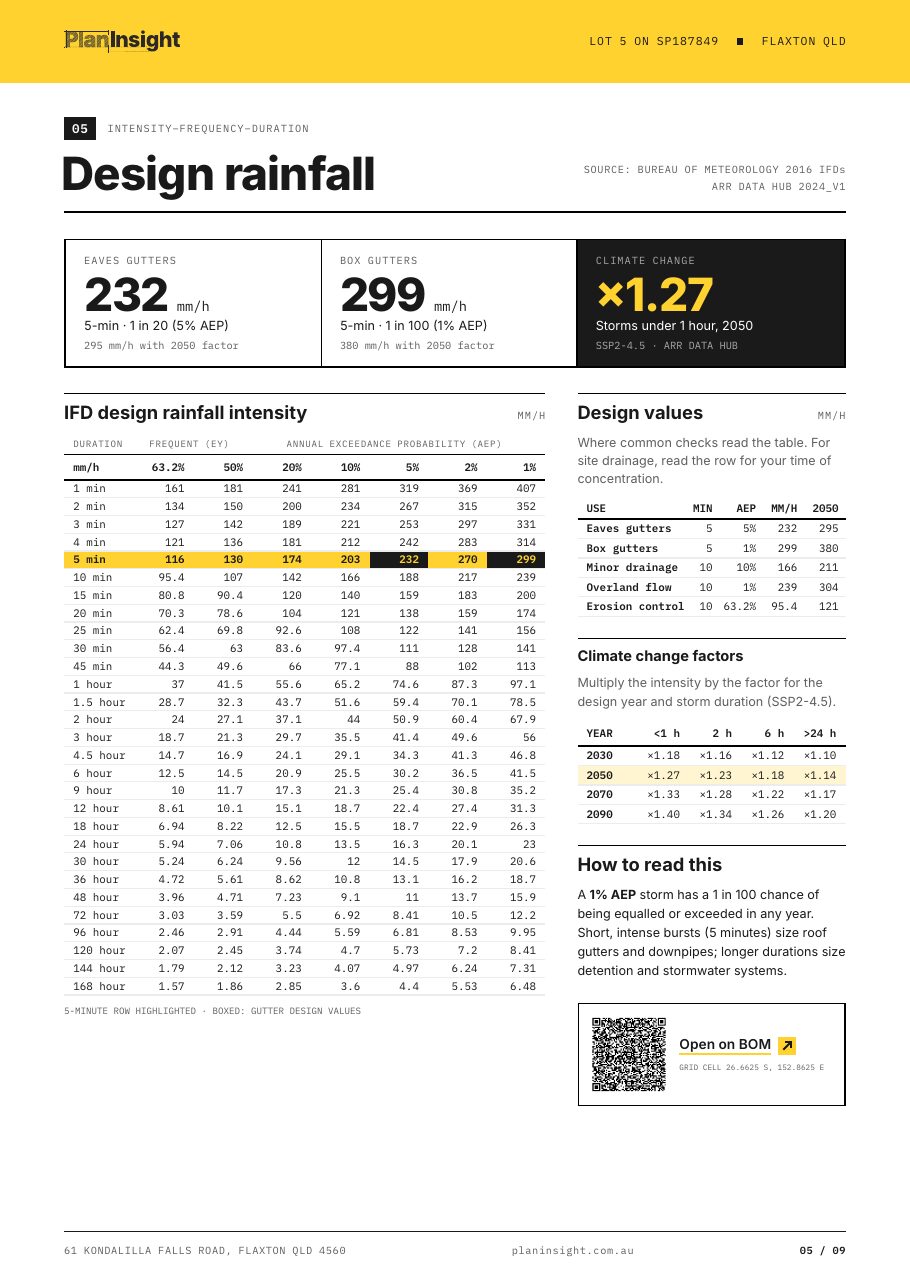
Hydraulic engineers read this at short durations and frequent events for gutters and pits. Civil engineers read the 1% AEP for major flow and detention. Both are in the table, for the actual site rather than the nearest town.
Registered water bores
Every registered bore on the lot and within 500 m of the boundary, from the Bureau of Meteorology’s national groundwater register: bore number, distance, status, depth and year drilled, each linked to its record. In New South Wales the drillers log and water bearing zones are printed for bores on the lot. Bore logs are the cheapest groundwater information that exists, and they are free, but almost nobody looks them up. Unregistered bores are in no register at all, so confirm on site.
Contours
Elevation contours clipped to the lot with labels, from the state LiDAR derived data where it is published. Enough to see fall, drainage direction and whether the site has a level problem, not a substitute for a detail survey.
Land valuation
For Queensland and New South Wales properties, the published statutory land valuation.
Council information
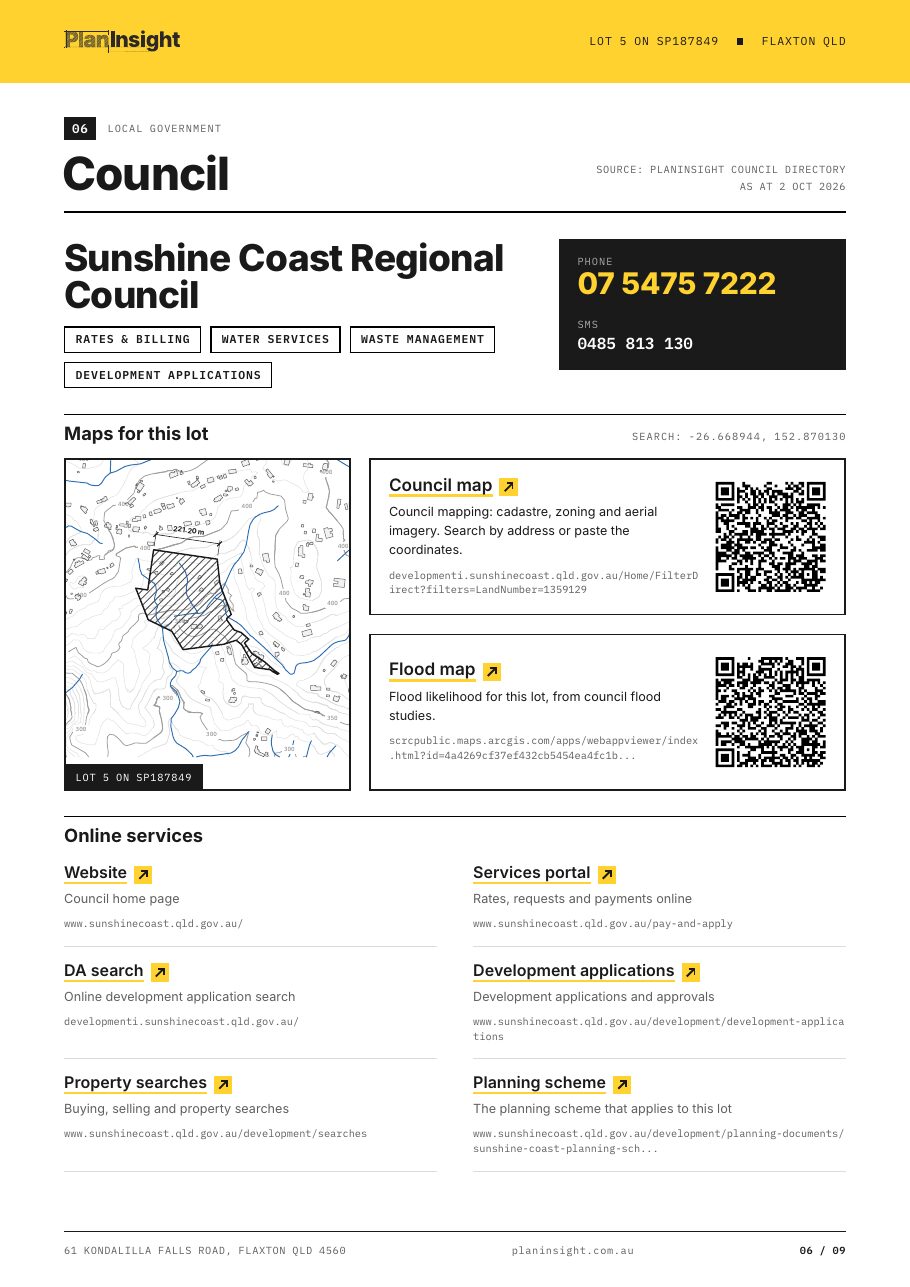
Contacts, the planning scheme, the council’s own maps for the lot and its online services, so the follow up call is one click rather than a search.
Source links and dates
Every section states its source and the date the data was fetched.
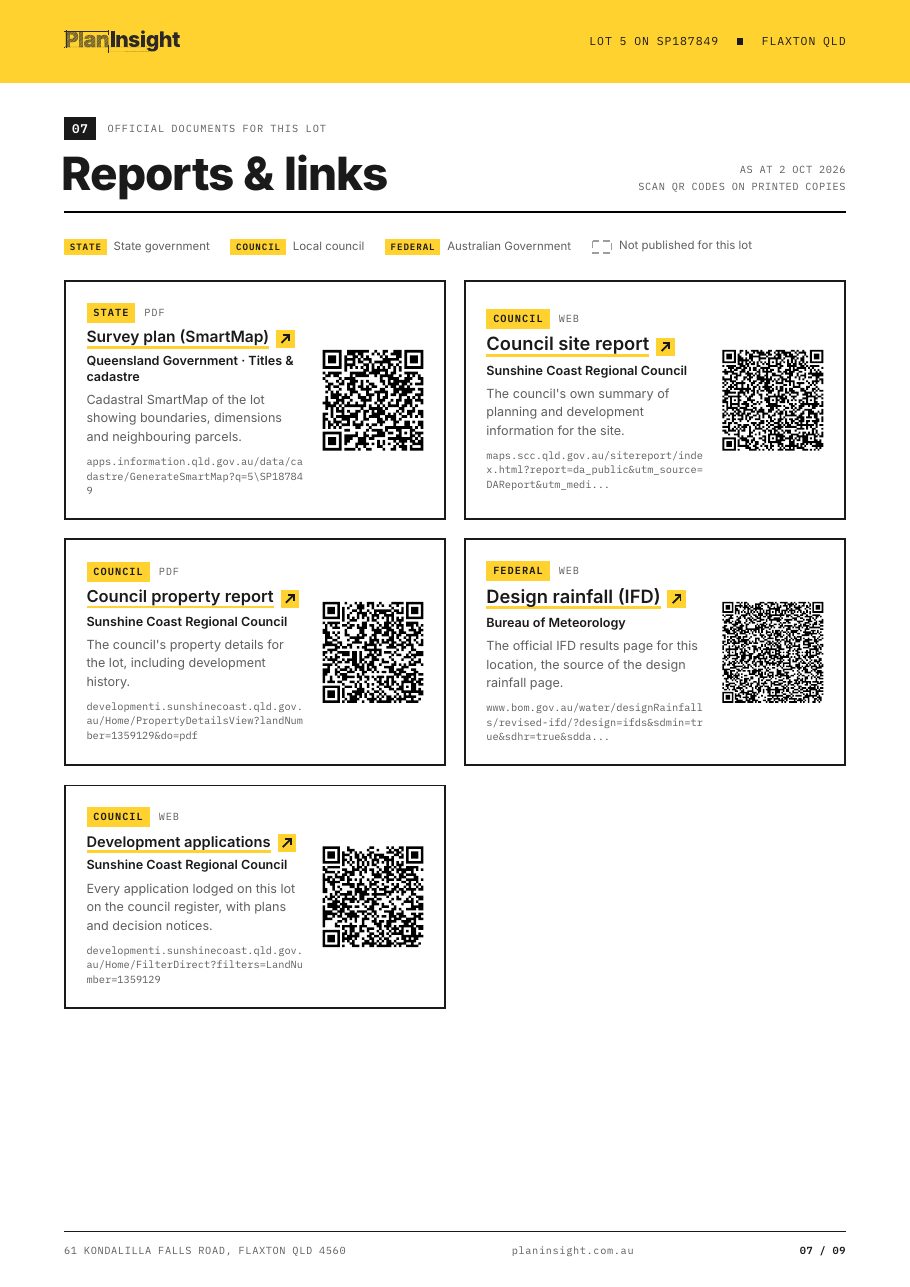
A dated source line is what makes a compiled report defensible. If a layer was updated last week, you can see that your report predates it. Sections with nothing published for the lot say so, rather than being quietly left out, so an empty section never reads as a clear result.
The DXF
A DXF R12 file in metres with the boundary and lot label, building outlines, contours with elevation labels, watercourses, water bores and each hazard overlay on its own layer. It opens in AutoCAD, Civil 3D, BricsCAD and QGIS.
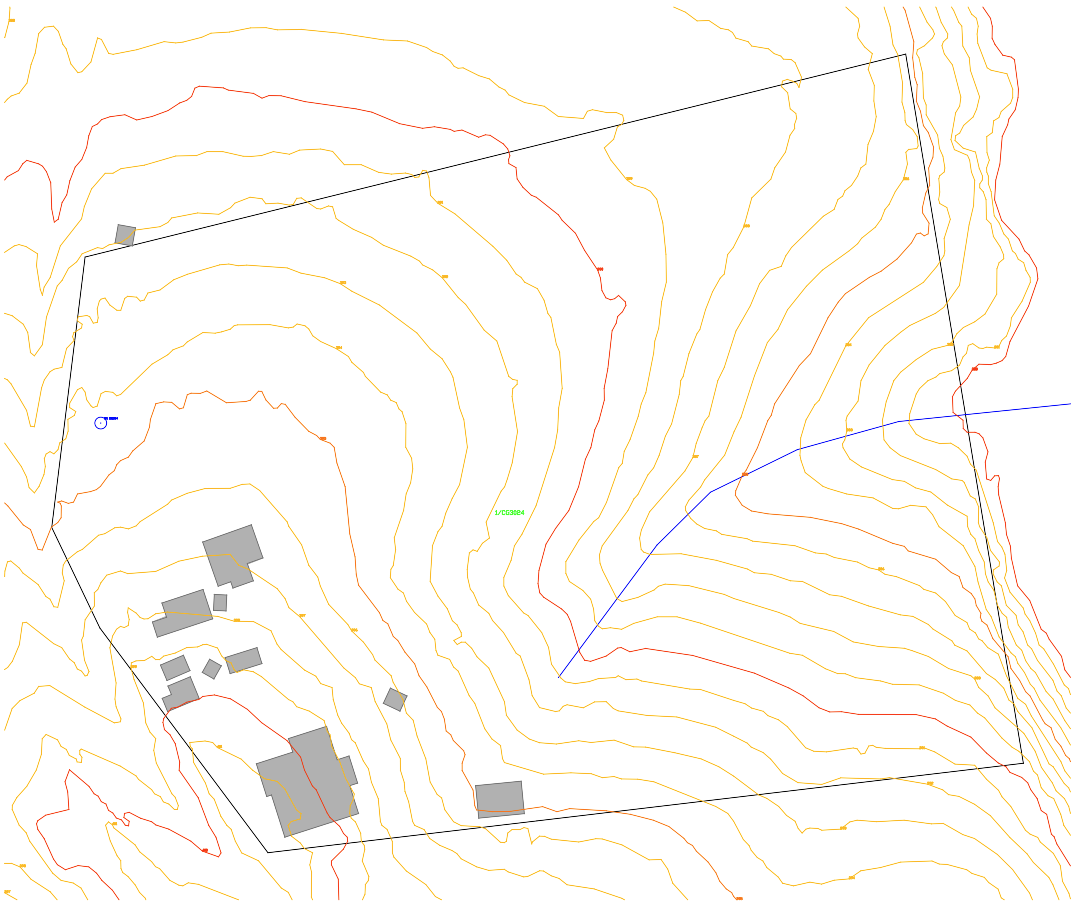
The DXF is in local coordinates, not MGA, so to combine it with a real survey you move or align it onto surveyed boundary corners. See property boundary DXF for AutoCAD.
When to collect it yourself
Every source above is free and public. If you are looking at one lot, in a state you work in daily, with the viewers already bookmarked, collecting it yourself is the right call. The desktop site feasibility checklist is the order to do it in.
When to pay for a report instead
A one off report earns its keep in four situations:
- Quoting. You need to know whether a site has a flood or bushfire problem before you commit to a fixed fee, and you are not billing the hour it takes to find out.
- A state you do not work in. Learning another jurisdiction’s viewers and DA register for one job costs more than the report.
- Something to put on the file. A dated PDF of what the public record said on the day you looked, next to the searches.
- You need the site in CAD. This is the one that is genuinely hard to do by hand. Tracing a screenshot of a boundary is both slow and wrong.
What it is not
A site report is a research report compiled from public government and council records. It does not replace a council planning certificate, a registered survey, a title search or professional advice. It will not tell you where the boundary pegs are, what the easements say, or whether the council will approve your scheme. Check anything you plan to rely on with the council or a licensed professional.
Price and coverage
The Site Report is $29 including GST, paid once, no account and no subscription. You search the address, confirm the lot on a map, then pay. It arrives by email as one zip with the PDF and the DXF. If a report fails to generate, it is refunded in full.
Reports are available in Queensland, New South Wales, Victoria, South Australia, Tasmania and the ACT. They are not available in Western Australia or the Northern Territory yet.
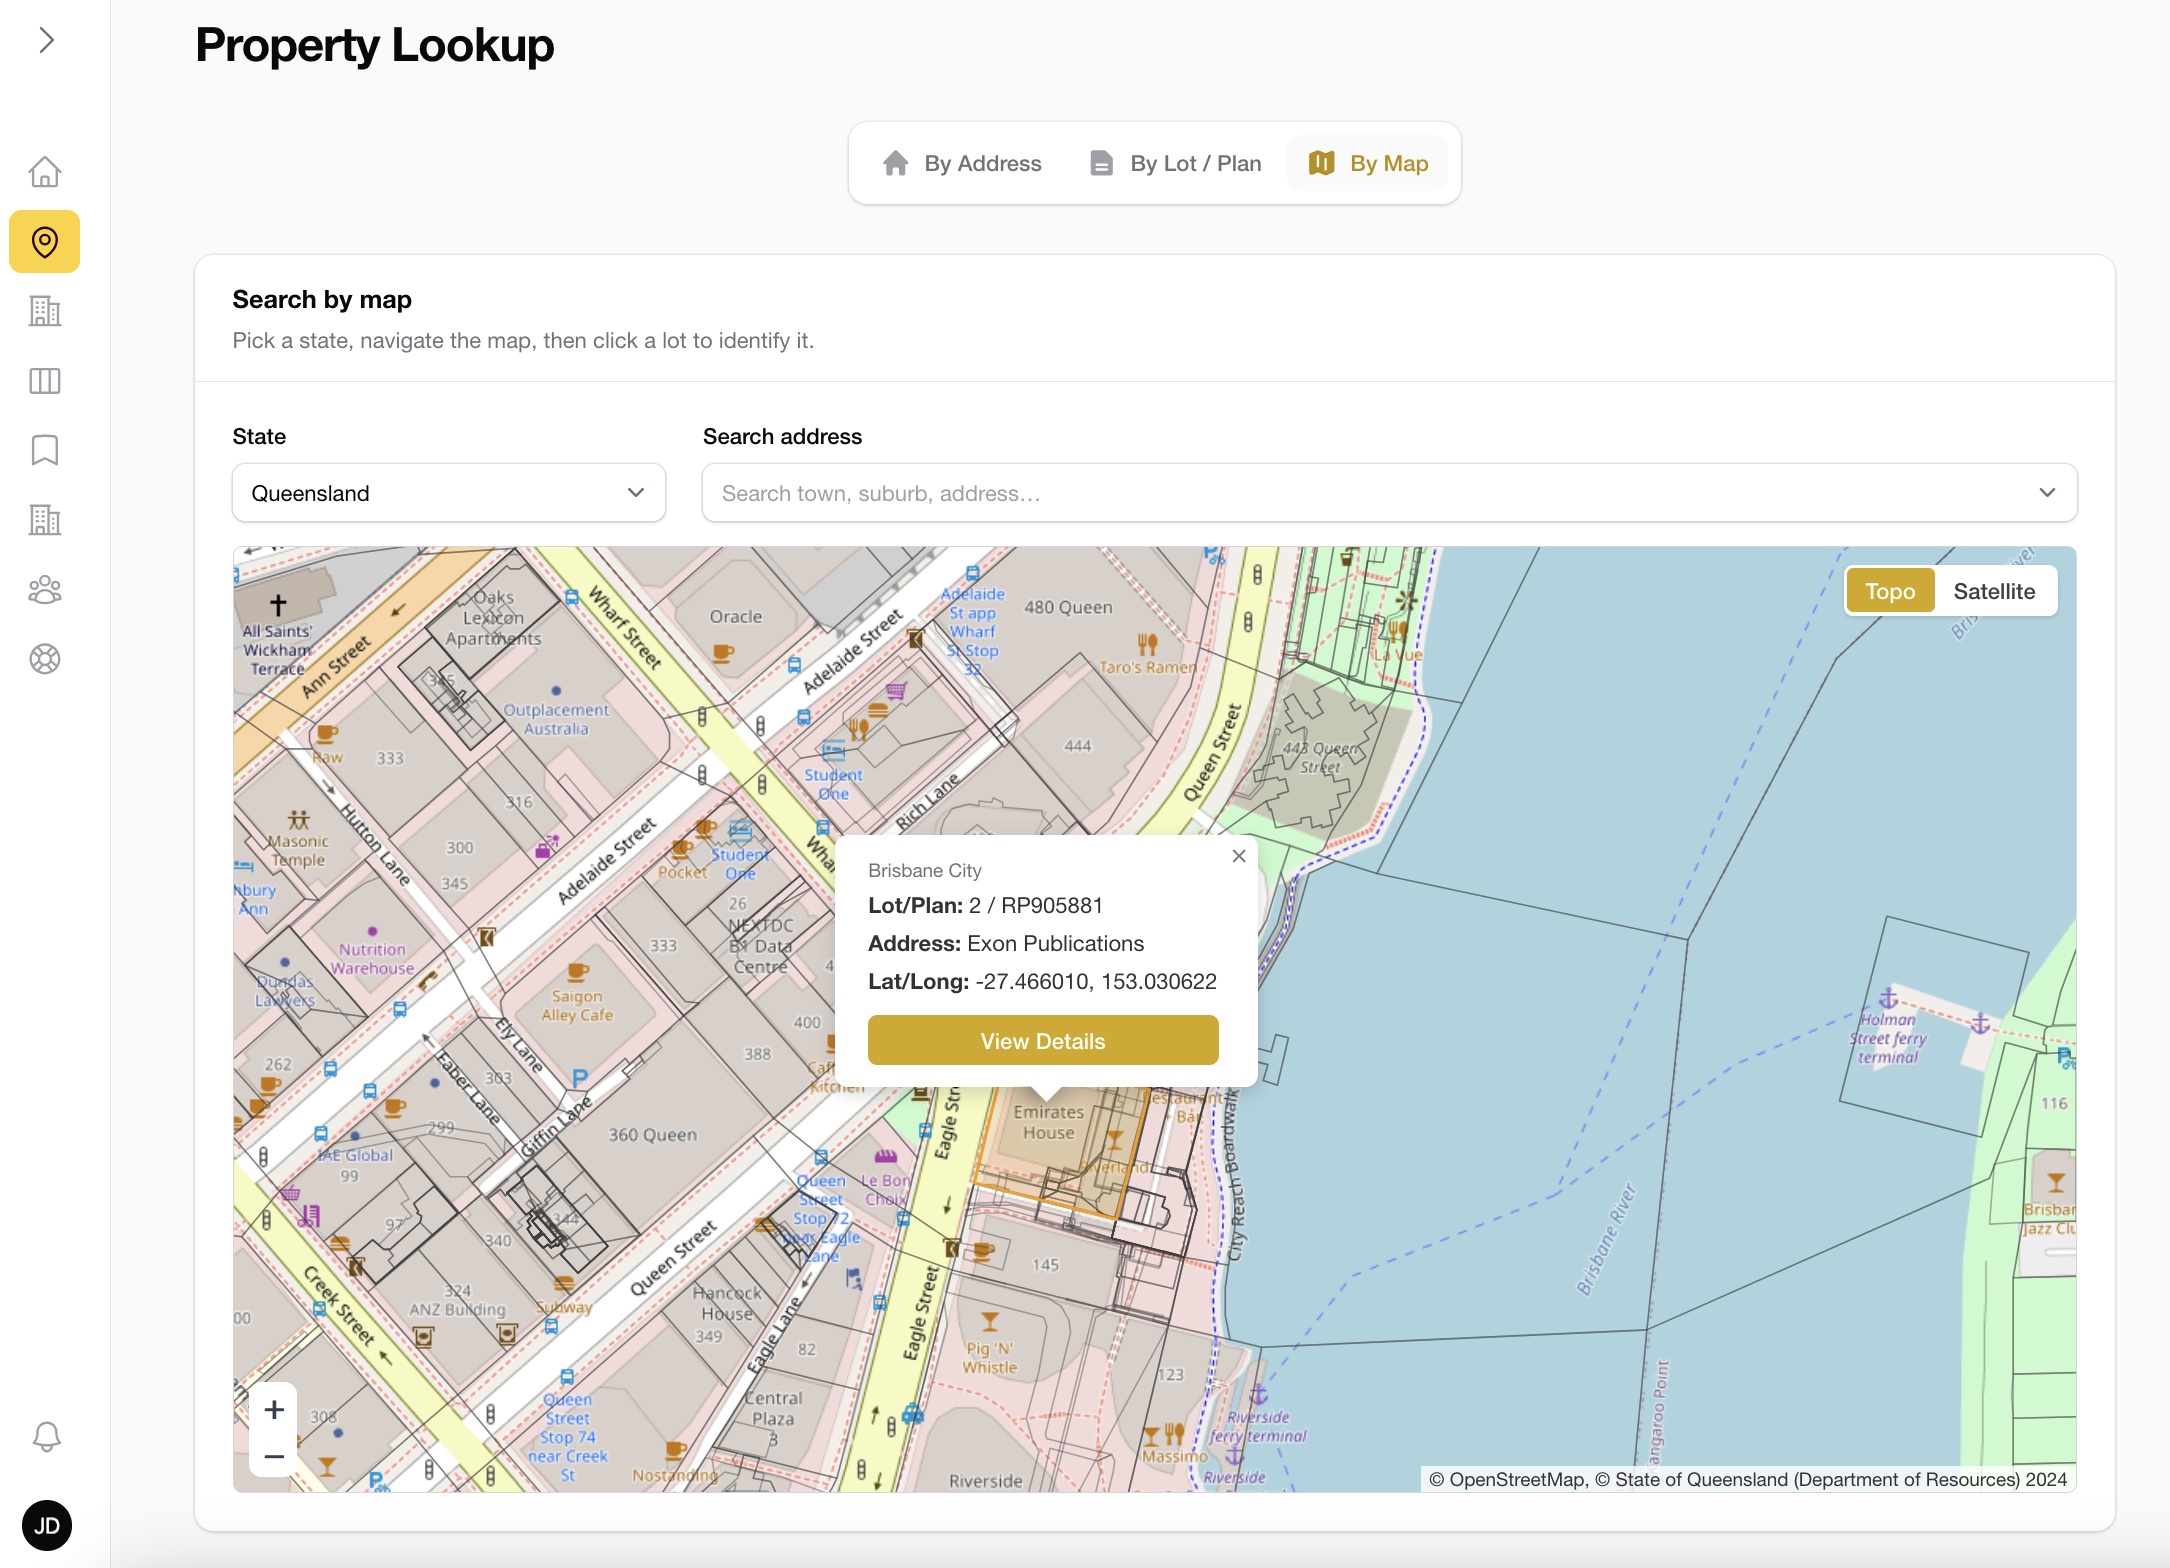
If you only need the lot boundary, the free property boundary download needs no account at all.