Contour map
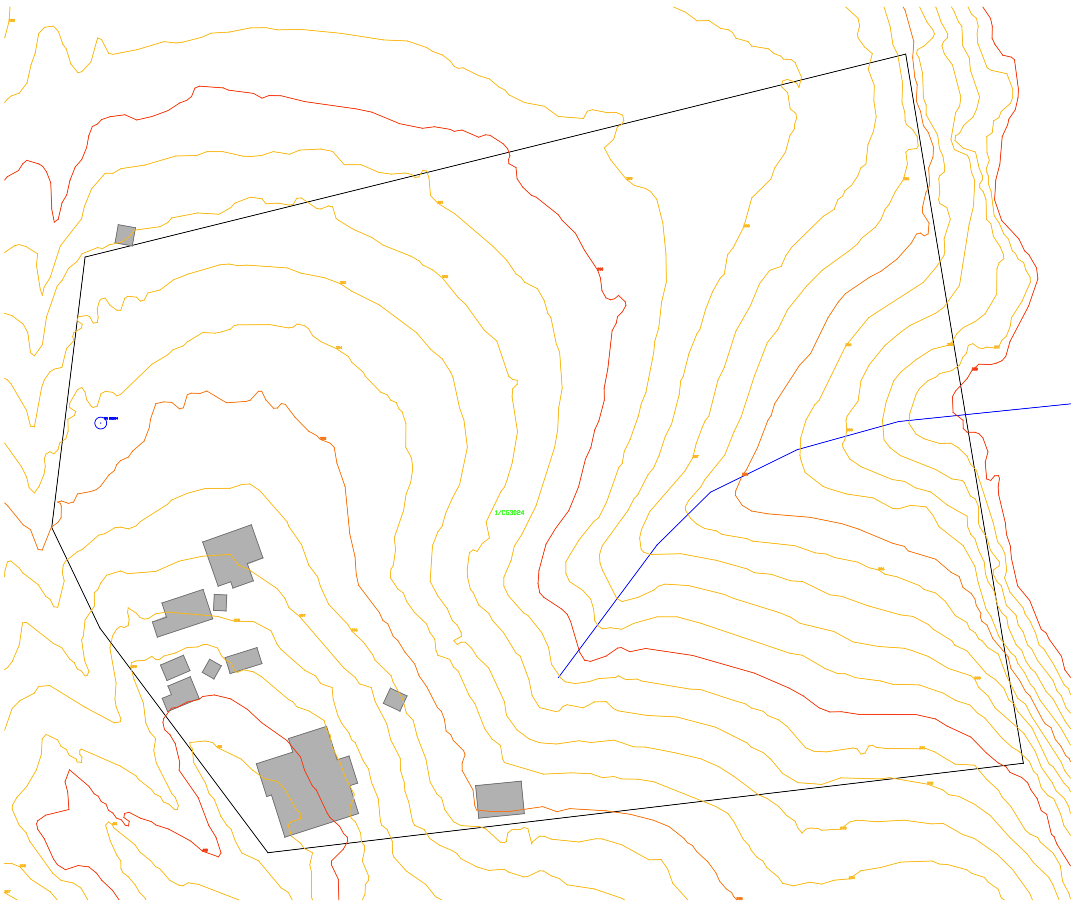
Search the address and get contours clipped to the lot, labelled in metres, with the boundary and buildings on the same drawing. From state LiDAR where it exists.
What you get
Public contour maps cover a whole region at one scale. This is one lot, at the finest interval the state has for that spot, with the fall across the site visible at a glance.
Only the contours that cross your boundary, plus a margin, so the slope of the block is obvious.
Every index contour carries its height, so you can read the fall from the street to the back fence.
1 m LiDAR contours where the state has flown it, coarser topographic contours where it hasn't. The interval tells you which.
The cadastral boundary and building outlines sit on the same drawing, so you can see where the slope lands.
A page in the PDF for people, and a layered DXF for AutoCAD, Civil 3D, BricsCAD or QGIS.
Mapped watercourses alongside the contours, useful for early stormwater and overland flow thinking.
By state
The interval depends on what the state publishes at the lot. Where several sources exist we use the finest one first.
| State | Contour interval | Site Report |
|---|---|---|
| Queensland | 1 m, 5 m, 10 m | $29 |
| New South Wales | 10 m, 20 m | $29 |
| Victoria | 1 m, 10 m, 20 m | $29 |
| South Australia | State topographic | $29 |
| Western Australia | 2 m, 10 m | $29 |
| Tasmania | 5 m, 10 m | $29 |
| Australian Capital Territory | Not yet | $29 |
| Northern Territory | 1 m, 5 m | $29 |
Steps of 1 m or 2 m mean LiDAR. Steps of 10 m or more mean topographic data and show the general fall only.
Site Report · $29
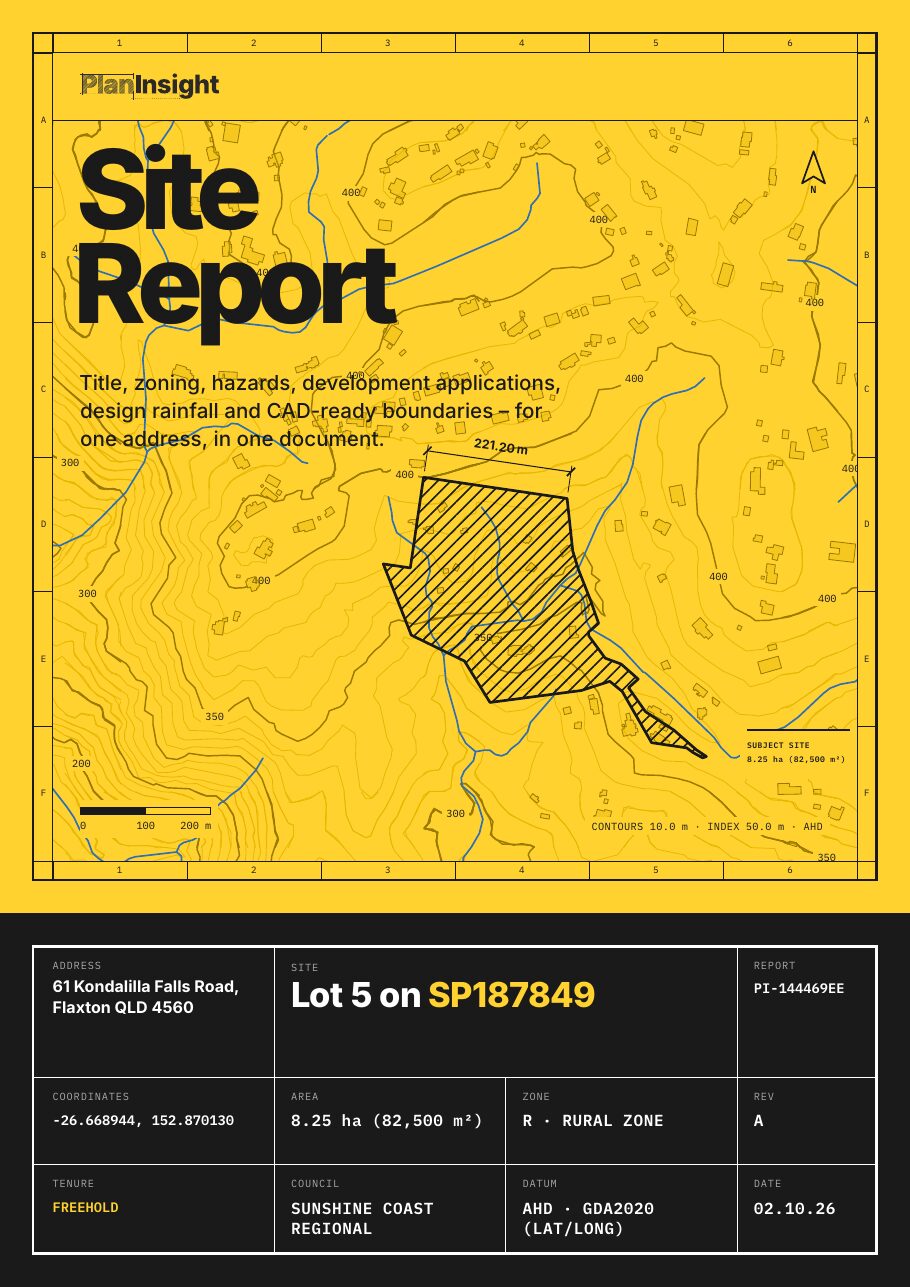
Title, zoning, hazard overlays, DA history, design rainfall and water bores for the same lot, in the same order.
One-off, no account. Emailed as a zip with the PDF and DXF.

As accurate as the state data behind it. LiDAR contours at 1 m intervals are good enough for siting, concept grading and feasibility. For earthworks volumes, detailed design or anything you lodge or certify, commission a detail and contour survey.
For a first look at the slope, yes. For design and approval, no. A licensed surveyor measures the actual ground; this draws what the state has mapped.
A PDF Site Report with the contour page, and a DXF R12 drawn in metres with contours on their own layers (minor, major and index with labels), plus the boundary, buildings and watercourses. It opens in AutoCAD, Civil 3D, BricsCAD and QGIS.
Every state and territory except the ACT, which has no state contour data yet. Western Australia has 2 m and 10 m contours.
No. The free tool on this site gives you the boundary only. Contours come with the $29 Site Report in every state that publishes them, and with every PlanInsight plan.
One-off · No account · PDF and DXF