Contours come from the finest elevation data the state publishes for that spot, with coarser data only where the fine data runs out.
CONTOUR_MINORThe finest interval available at the lot, as close as 1 m where LiDAR exists.
CONTOUR_MAJOREvery fifth line on its own layer, so the terrain reads at a glance.
CONTOUR_INDEXElevation labels in metres, so you can check falls without leaving CAD.
BOUNDARYContours line up with the lot boundary and buildings. No reprojecting or clipping.
WATERCOURSEMapped watercourses alongside the contours, handy for early stormwater thinking.
OVERLAY_FLOOD_*Where a mapped flood overlay crosses the lot, it's exported in the same drawing.
Download a sample DXF → the file pictured above, all layers
Boundaries work for every address in Australia. The rest depends on what each state publishes.
| State | Contours | Hazard overlays | Other layers |
|---|---|---|---|
| Queensland | 1 m, 5 m, 10 m | Flood, Bushfire, Coastal, Landslide, Steep land, Acid sulfate soils (some councils) | Building Outlines, Watercourse, Water Bores |
| New South Wales | 10 m, 20 m | Flood, Bushfire, Landslide, Acid Sulfate Soils, Coastal management | Building Outlines, Watercourse, Water Bodies, Water Bores |
| Victoria | 1 m, 10 m, 20 m | Flood, Bushfire, Landslide | Building Outlines, Watercourse, Water Bores |
| South Australia | State topographic | Flood, Bushfire, Acid Sulfate Soils, Coastal | Building Outlines, Watercourse, Water Bores |
| Western Australia | 2 m, 10 m | Flood, Bushfire, Acid Sulfate Soils | Building Outlines, Watercourse, Water Bores |
| Tasmania | 5 m, 10 m | Flood, Bushfire, Landslide, Coastal | Building Outlines, Watercourse, Pathways & Tracks |
| Australian Capital Territory | Not yet | Flood, Bushfire | Building Outlines, Watercourse |
| Northern Territory | Not yet | Not published | Building Outlines, Water Bores, Watercourse |
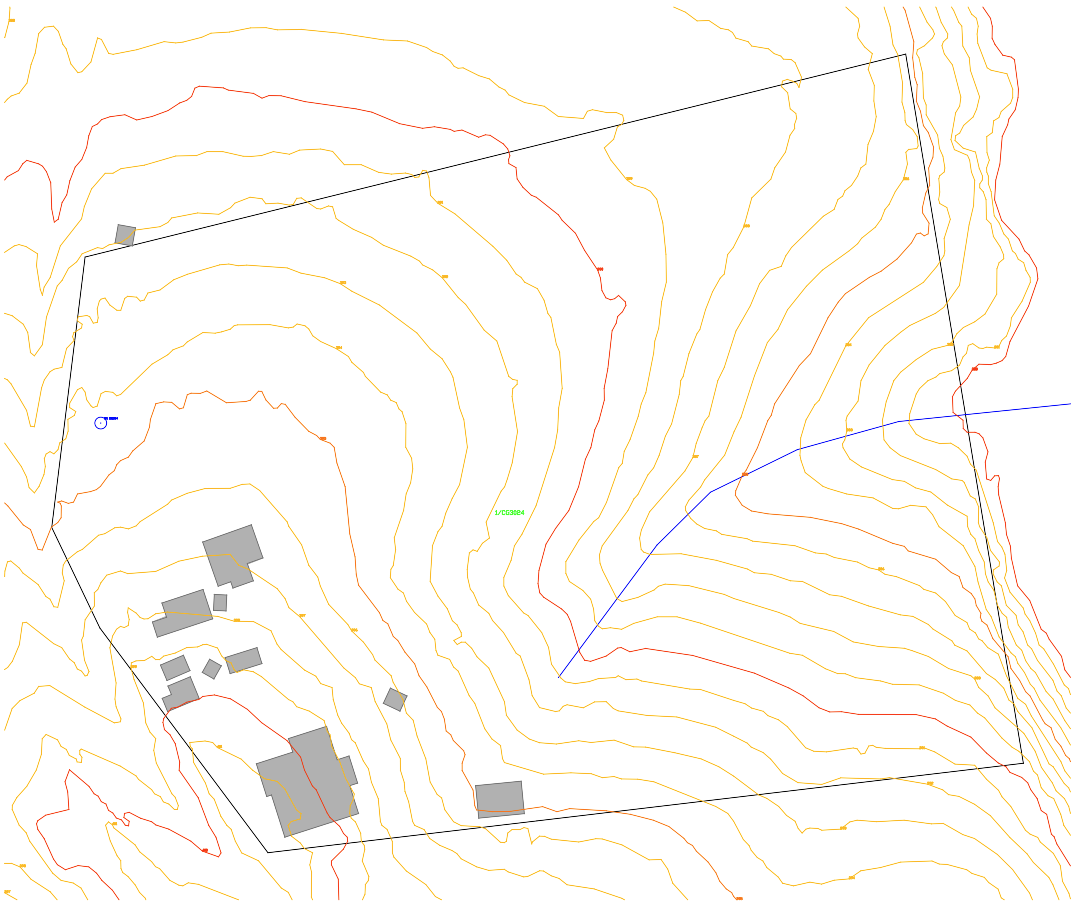
Contours use the finest source available at the lot first. Council flood studies replace the statewide layer where the council publishes one.
The index labels tell you the source: steps of 1 m mean LiDAR, steps of 10 m or more mean coarser state or satellite data.
Drawn in metres about the lot centroid, not MGA. MOVE or ALIGN onto your survey base.
Great for siting, concept grading and yield. Detailed design and earthworks still need a detail and contour survey.
It depends on the state and the data at the lot. We use the finest source first, as fine as 1 m where LiDAR exists, and fall back to coarser contours where it doesn't. The table above lists the sources per state.
Queensland, New South Wales, Victoria, South Australia, Western Australia and Tasmania. The ACT and Northern Territory aren't available yet; you still get the boundary, buildings and watercourses there.
For concept design, siting and feasibility, yes. For detailed design, earthworks volumes or anything lodged or certified, commission a detail and contour survey.
No. The free tool gives you the boundary and lot label. Contours come with every PlanInsight plan, and the 14-day trial needs no credit card.
14-day free trial, no credit card. Plans from $49/mo after that.