Flood and bushfire check

Is the property flood or bushfire prone, and how much of it?

Search the address and see every hazard overlay that crosses the lot, drawn on the boundary, with the percentage of the block each one covers. From state planning maps and council flood studies.

  • $29 incl. GST
  • One-off
  • No account
  • PDF and DXF
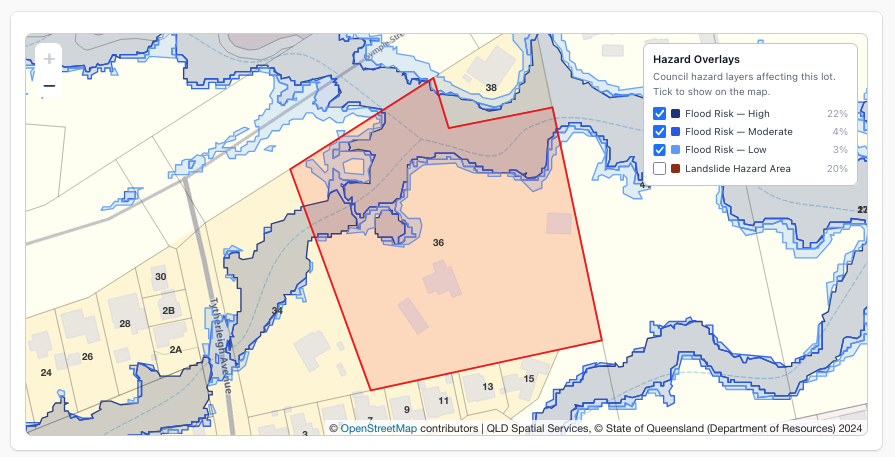
Flood and landslide overlays drawn over a property boundary

What you get

Not just whether, but where and how much.

A council flood map says the suburb is affected. The report draws the overlay on your boundary and tells you the share of the lot it covers, which is what decides whether the house pad is in it.

Flood

Flood planning areas and, where the council publishes its own study, high, medium and low risk bands.

Bushfire

Bushfire prone land and bushfire hazard areas from state and council planning maps.

Landslide and steep land

Landslide hazard and steep land overlays where the state or council maps them.

Coastal and acid sulfate soils

Storm tide, erosion prone, coastal management and acid sulfate soil mapping where published.

Share of the lot

Each overlay shows whether it touches the lot and the percentage it covers.

Drawn in CAD

Every overlay that crosses the lot is a layer in the DXF, alongside the boundary and contours.

By state

Overlays mapped by state

Overlays come from state planning mapping everywhere we cover, and from council flood studies where a council publishes its own. Council studies replace the broader state layer.

StateOverlays mappedSite Report
QueenslandFlood, Bushfire, Coastal$29
New South WalesFlood, Bushfire, Landslide, Acid Sulfate Soils, Coastal$29
VictoriaFlood, Bushfire, Landslide$29
South AustraliaFlood, Bushfire, Acid Sulfate Soils, Coastal$29
Western AustraliaFlood, Bushfire, Acid Sulfate Soils$29
TasmaniaFlood, Bushfire, Landslide, Coastal$29
Australian Capital TerritoryFlood, Bushfire$29
Northern TerritoryAcid Sulfate Soils, Coastal$29

An overlay that does not touch the lot is reported as clear, so you know it was checked.

Site Report · $29

Hazards, zone and DAs, in one PDF.

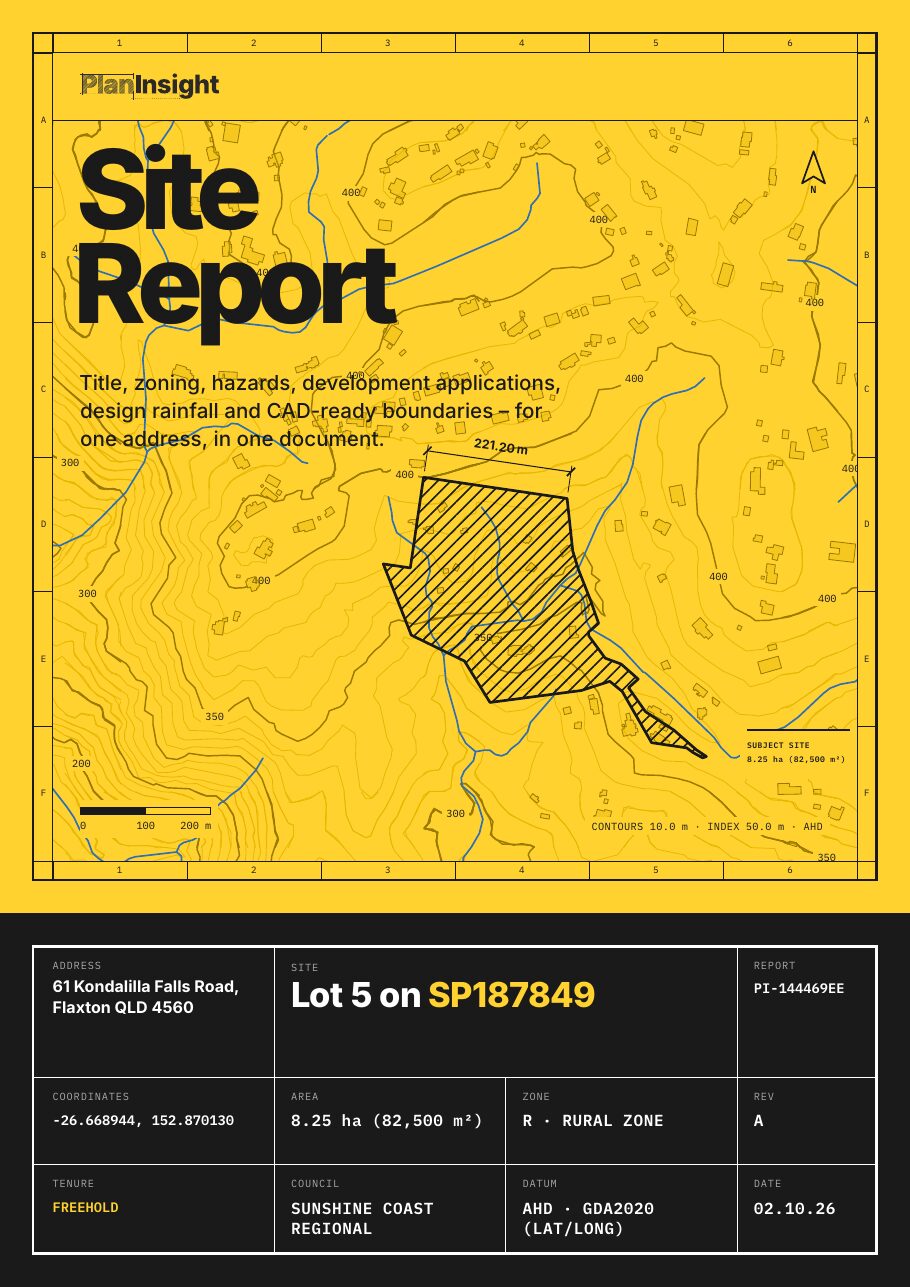
The overlays are one section. The same report carries the zone, title, DA history, contours, design rainfall and water bores for the lot.

  • Title details: lot and plan, land area and tenure
  • Zoning, where the council publishes it
  • Flood, bushfire and other hazard overlays, where mapped
  • Development application history for the lot
  • Contours and elevation
  • Land valuation (Queensland and New South Wales properties)
  • A CAD-ready DXF: property boundary, building outlines, watercourses, water bodies, water bores, elevation contours, pathways and easements (indicative), where the state publishes them

One-off, no account. Emailed as a zip with the PDF and DXF.

FAQ

Questions

Look through the sample report first, or get in touch.

Is this a flood certificate or a BAL rating?

No. A flood certificate or flood level search comes from the council, and a Bushfire Attack Level (BAL) assessment is done on site by an accredited assessor. The report shows which overlays the planning maps put on the lot, which tells you whether you need either of those.

Where does the flood data come from?

State planning overlays everywhere we cover. Where a council publishes its own flood study (Brisbane, Sunshine Coast and others), that study replaces the state layer because it is finer and more current.

What if the lot is clear?

The report says so, section by section, with the source and the date. A clear result is as useful as a hit when you are deciding on a block.

Which states are covered?

Every state and territory, each with the overlays that state publishes. The table above lists them.

Check the block before the deposit.

One-off · No account · PDF and DXF