IFDFor hydraulic & stormwater engineers

Design rainfall and stormwater data for any lot.

BOM 2016 IFD intensities for the site's grid cell, gutter and drainage design values, climate-change factors to 2090, flood overlays, contours and the boundary in CAD. One Site Report, before you write the fee proposal.

One-off · no account · BOM 2016 IFDs · ARR Data Hub

05 · Design rainfallmm/h
Eaves gutters
232
5-min · 5% AEP
Box gutters
299
5-min · 1% AEP
2050 factor
×1.27
Storms under 1 h
UseMinAEPmm/h2050
Eaves gutters55%232295
Box gutters51%299380
Minor drainage1010%166211
Overland flow101%239304
Erosion control1063.2%95.4121

Sample: Lot 5 SP187849, Flaxton QLD, BOM 2016 IFD

The job

Where can the water leave this site, and how hard will it rain?

If the lot falls to the kerb, the lawful point of discharge is usually easy. If it falls to the rear, you're looking for a drainage easement, a council pit or a watercourse downstream, or a detention or pump-out solution, and each of those is a different scope and fee.

The Site Report puts the inputs for that call on your desk: the full IFD table for sizing, contours and watercourses for fall and catchment, flood overlays with the share of the lot affected, and the DA history for conditions that changed the drainage. Council flood studies replace the state layer in Brisbane, Gold Coast, Logan, Moreton Bay and Sunshine Coast.

The stormwater feasibility guide walks through the full desktop workflow for a Queensland lot. Flood levels and design still come from the council and your own modelling.

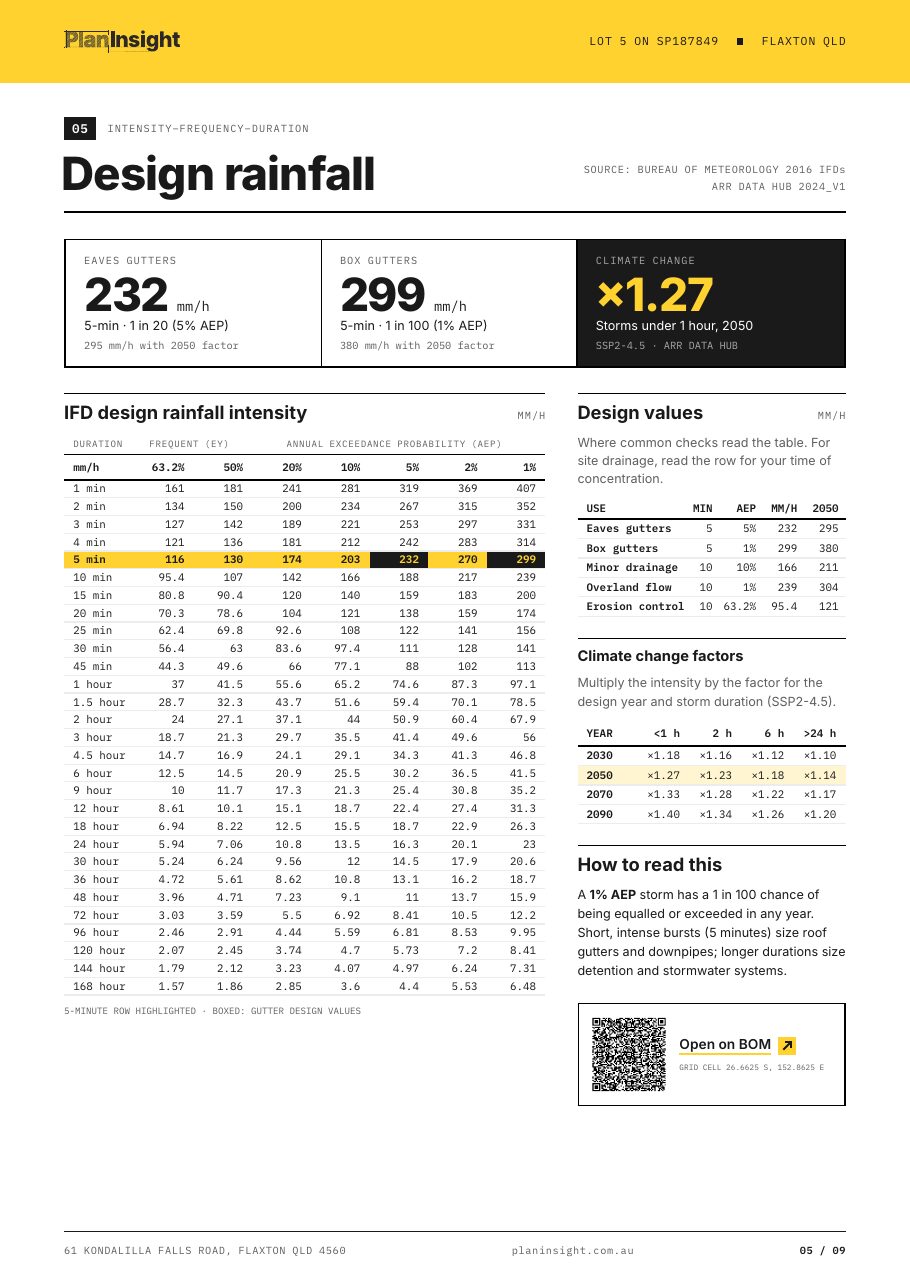
Design rainfall page from a Site Report with the full IFD table and design values

In the Site Report for hydraulic work

  1. 01

    IFD table, 1 min to 168 hours

    Frequent and AEP columns from 63.2% to 1%, with the 5-minute row highlighted for gutters.

  2. 02

    Design values and 2030 to 2090 factors

    Eaves and box gutters, minor drainage, overland flow and erosion control, with SSP2-4.5 uplift by storm duration.

  3. 03

    Flood overlays, % of lot

    State mapping, replaced by the council flood study where one is published.

  4. 04

    Contours and watercourses in the DXF

    Labelled contours from the best elevation data the state publishes, clipped around the lot. In Queensland that's 1 m LiDAR where flown.

  5. 05

    Survey plan and DA history

    A link to the survey plan to check for drainage easements (Queensland), and earlier approvals with their council records.

Before the fee is agreed, not after.

The manual way

  • Running the BOM IFD tool by hand, then copying values into the calc sheet.
  • Pulling contours, flood mapping and utility plans from three different systems.
  • Finding out after the fee is agreed that the lot drains away from the street.
  • Reading the survey plan for an easement nobody mentioned.

With the Site Report

  • IFD table and design values for the exact grid cell, dated and sourced.
  • Contours, watercourses and flood overlays in one layered DXF.
  • Fall and catchment visible before you quote.
  • Survey plan link and DA history in the same document.

Guides for this work

FAQ

Questions from hydraulic engineers

Which IFD data does the report use?

Bureau of Meteorology 2016 IFDs for the site's grid cell, with climate-change factors from the ARR Data Hub. The report links to the BOM results page for that cell.

Can it tell me the lawful point of discharge?

No, that's your call. It gives you the inputs: fall, watercourses, flood overlays, the survey plan to check for easements, and earlier approvals on the lot.

Does it give flood levels?

No. It shows which mapped flood overlays touch the lot and how much of it they cover. Flood levels and freeboard come from the council's flood search or your own modelling.

Can I see council stormwater pipes?

Not in the Site Report. With a PlanInsight plan you can lodge a BYDA enquiry from the property page, and where the council or water utility is a BYDA member its plans show the stormwater, sewer and water assets near the lot.

Is the DXF in MGA?

No. It is in local coordinates in metres about the lot centroid, north up. Move it onto your survey control in CAD when you have one.

Know where the water goes before you quote.