For cadastral & development surveyors
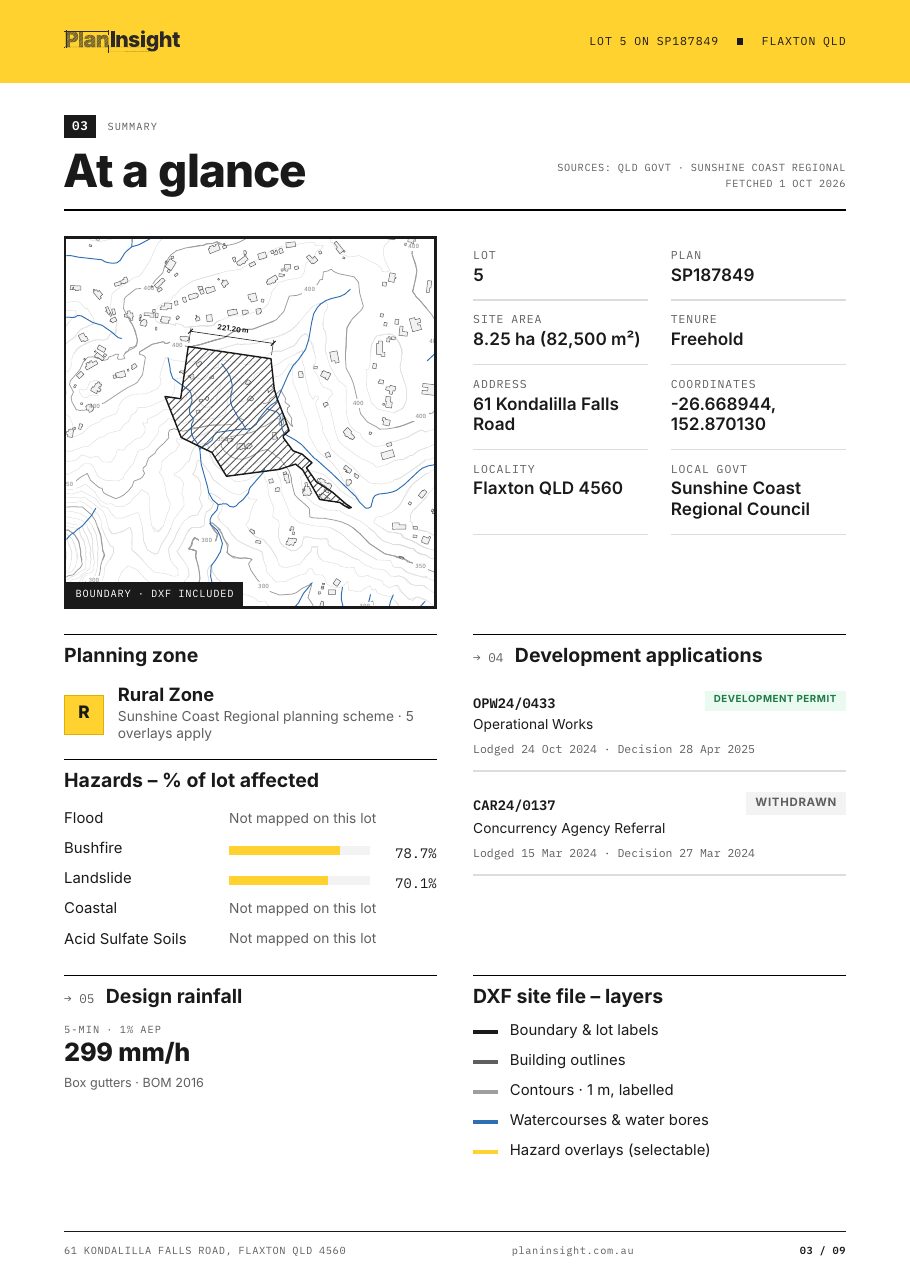
Lot and plan, area and tenure, a boundary and contour DXF you can open in your CAD package, a link to the survey plan and the DA history of the lot. One Site Report for any address, before you quote or drive out.
One-off · no account · sources and fetch dates on every page

The job
Every cadastral or detail survey starts at a desk. You confirm the lot and plan, pull the registered plan, work out which adjoining lots matter, and set up a drawing with the cadastre so field time goes on measuring, not searching.
The Site Report does that desk work from one address. It prints the lot, plan, area and tenure, and the DXF gives you the boundary, parcel labels, building outlines, watercourses and contours on separate layers, in metres. In Queensland the contours come from 1 m LiDAR where the state has flown it, then 5 m, with 10 m SRTM as the fallback.
The DXF is drawn in local coordinates about the lot centroid, not MGA, so treat it as a base to set up the job and bring it onto your control once you have occupied a mark. It is cadastre as published, not a substitute for your own survey.
One check that saves a return trip: read the DA history for the lot so a recent subdivision or building approval does not surprise you on site.
In the Site Report for survey work
From the state cadastre, with the coordinates of the lot and the local government it sits in.
DXF R12 with boundary, parcel labels, building footprints, watercourses and labelled contours, ready for AutoCAD, Civil 3D, BricsCAD or QGIS.
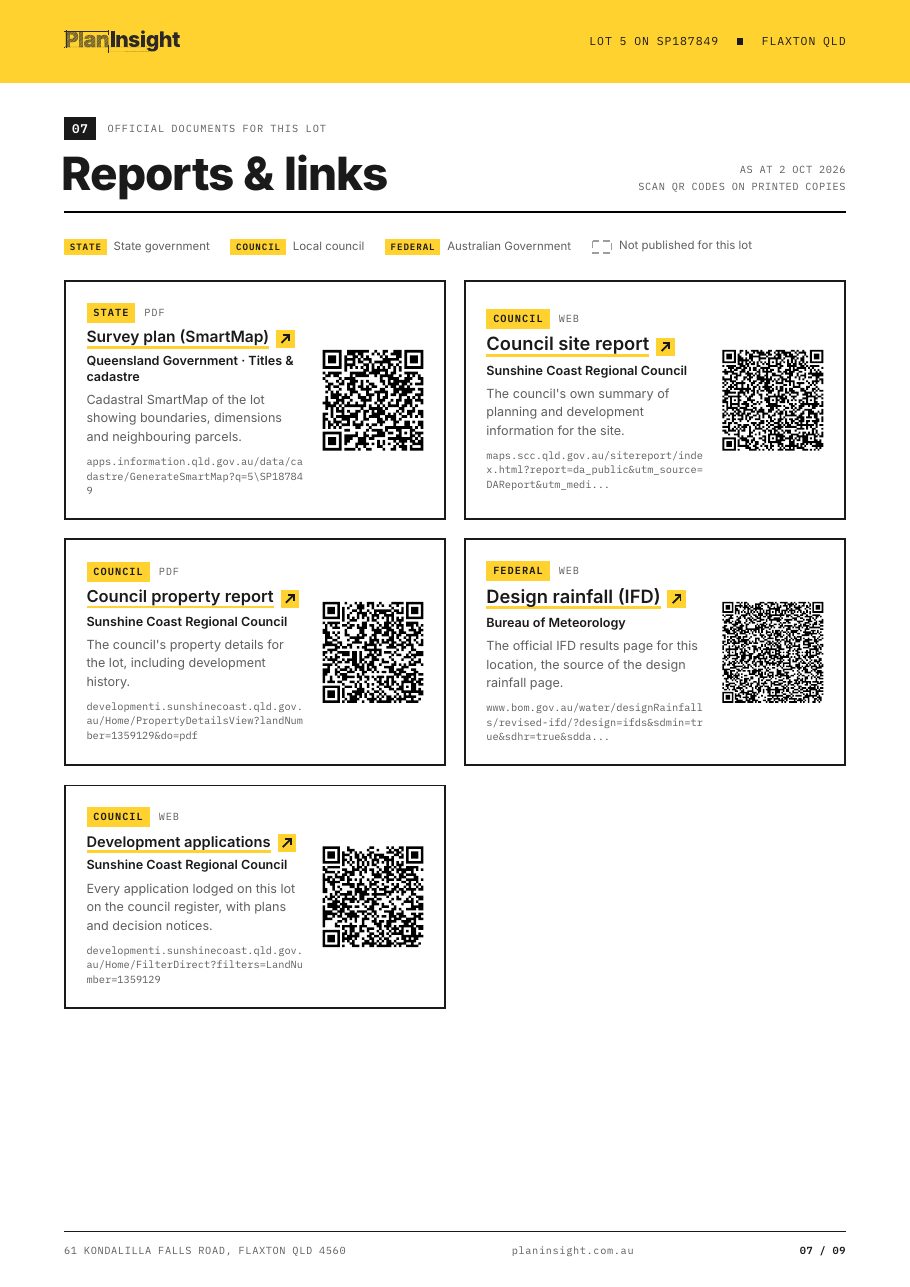
A link to the survey plan in Queensland, plus the council's own property and planning pages for the lot.
Recent subdivision, building and operational works applications, with links to the council record.
Flood, bushfire and other overlays with the share of the lot affected, and the planning zone where the council publishes it.
The manual way
With the Site Report
Guides for this work
FAQ
No. The DXF is drawn in metres in local coordinates about the lot centroid, so it opens cleanly at a sensible scale. Move it onto MGA or your site control in your CAD package once you have tied into a mark.
No. It is the state cadastre as published, which is good for setting up a job and checking context. Boundary definition still needs a registered survey and the survey plan.
The finest source the state publishes at the lot. In Queensland that is 1 m LiDAR contours where available, then 5 m, then 10 m SRTM as a fallback. In the Northern Territory we draw them from Geoscience Australia's elevation models: 1 m around Darwin where LiDAR was flown, an indicative 5 m elsewhere. The ACT has no contours in PlanInsight yet.
In Queensland the Site Report links to the survey plan for the lot. With a plan, the property page also generates other state reports, such as the NSW Planning Portal property report and the ACT block dimension report.
The lot boundary and parcel label layers for any Australian address, no account needed. Contours, buildings, watercourses and hazard overlays come with the $29 Site Report or a plan.