IFDFor civil & land development engineers

Desktop site investigation
for civil engineers.

Levels and fall from contours, the overlays that trigger assessment, design rainfall for pits, pipes, overland flow and detention, and what has already been approved on the lot. One Site Report with the lot in CAD, before the fee proposal.

One-off · no account · BOM 2016 IFDs · layered DXF

05 · Design rainfallmm/h
Minor drainage
166
10-min · 10% AEP
Overland flow
239
10-min · 1% AEP
2050 factor
×1.27
Storms under 1 h
UseMinAEPmm/h2050
Minor drainage1010%166211
Minor drainage2010%121154
Overland flow101%239304
Detention301%141179
Detention1201%67.983.5

Sample: Lot 5 SP187849, Flaxton QLD, BOM 2016 IFD

The job

What the desktop site investigation needs before the site visit

Civil scope depends on a handful of facts: how much the lot falls and in which direction, where the water goes, which overlays apply, what the design storms look like and what the council has already approved there. Most of that is public. The work is collecting it.

The Site Report collects it from one address. The DXF has the boundary and contours on separate layers in metres, so you can build a rough surface and read fall straight away. In Queensland contours come from 1 m LiDAR where flown, then 5 m, then 10 m SRTM; other states use the best source they publish.

The rainfall page prints the full BOM IFD table for the site's grid cell. Read the minor drainage row at your time of concentration (usually 5 to 20 minutes on a small lot), the 1% AEP row for overland flow, and the 10% and 1% columns across longer durations to find the critical storm for detention. If the client sends a 12d model later, the free 12d to DXF converter opens it without a 12d licence.

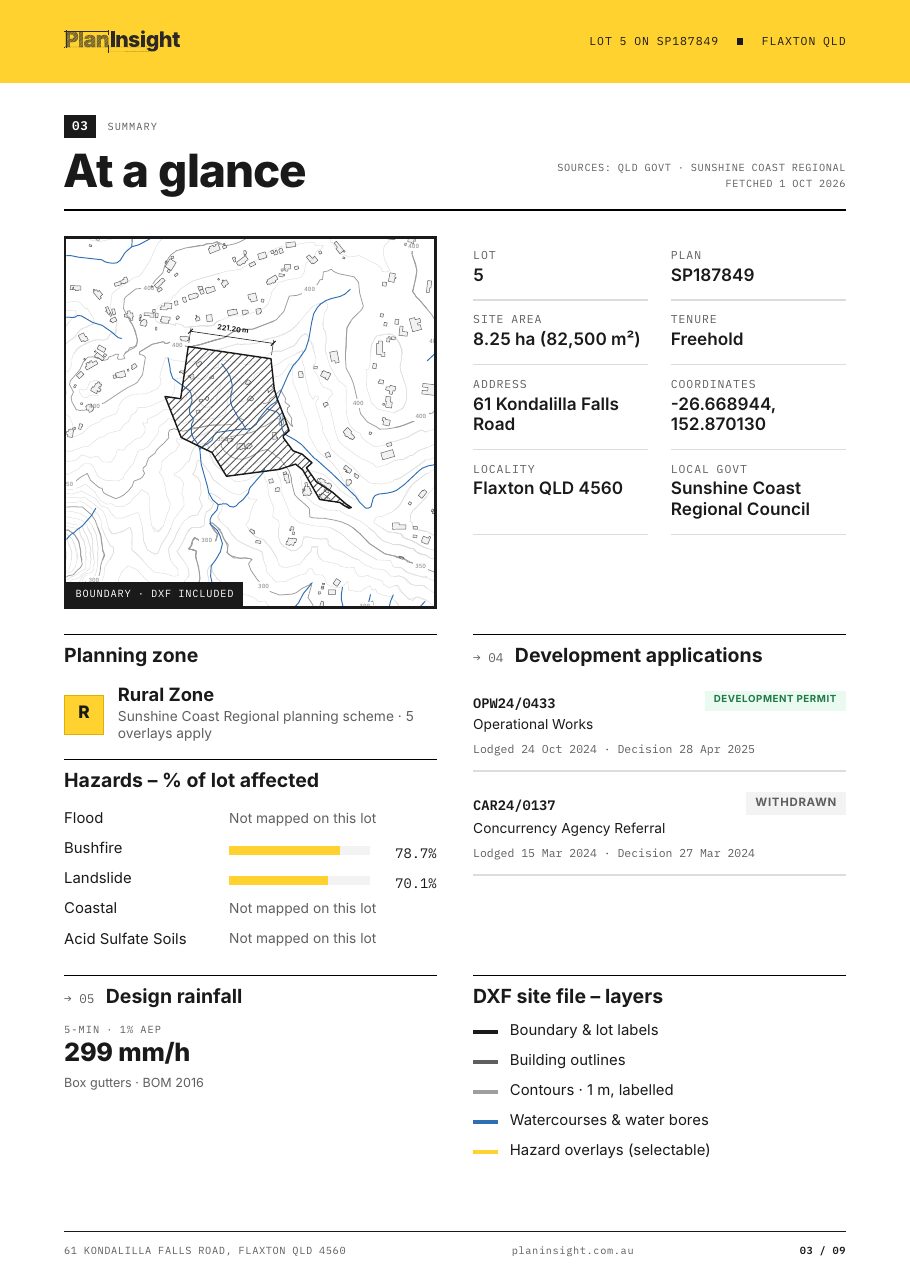
At a glance page from a Site Report with the lot map, zone, hazards and DA summary

In the Site Report for civil work

  1. 01

    Contours and boundary in one DXF

    CONTOUR_INDEX, CONTOUR_MAJOR and CONTOUR_MINOR layers with elevation labels, the lot boundary, buildings and watercourses, ready for a Civil 3D surface.

  2. 02

    Hazard overlays, % of lot

    Flood, bushfire, landslide and coastal overlays where the state or council maps them, with the share of the lot each one covers.

  3. 03

    IFD table, 1 min to 168 hours

    Every AEP from 63.2% to 1%, so the minor drainage, overland flow and detention rows are all on one page.

  4. 04

    Climate-change factors to 2090

    ARR Data Hub uplift by storm duration and year, ready to apply to the design intensity.

  5. 05

    DA history for the lot

    Earlier subdivision, earthworks and operational works approvals, with links to the council records.

Real levels before the scope is set.

The manual way

  • Quoting earthworks and drainage before you have any levels.
  • Stitching contours from a state portal onto a cadastre screenshot.
  • Running the BOM IFD tool by hand for every new site.
  • Learning about a flood overlay after the fee is agreed.

With the Site Report

  • Contours and boundary in one DXF, ready for a Civil 3D surface.
  • Flood, bushfire, landslide and coastal overlays with the share of the lot affected.
  • The full IFD table and climate factors for the site, dated and sourced.
  • DA history for the lot to spot prior earthworks or subdivision approvals.

Guides for this work

FAQ

Questions from civil engineers

Which rainfall row should I read for pits and pipes?

Use the duration that matches the site's time of concentration, often 5 to 20 minutes on a small lot, at the AEP your council's drainage manual sets for the land use (in Queensland, QUDM often gives 10%). The report prints every row, so pick yours rather than a single highlighted cell.

Can I build a Civil 3D surface from the contours?

Yes. The contours are polylines with elevations on their own layers, so you can add them to a TIN surface as contour data. Treat it as a desktop surface for scoping; design levels need a detail survey.

Is the DXF in MGA?

No. It is drawn in metres in local coordinates about the lot centroid. Move it onto MGA or your survey control in CAD when the detail survey arrives.

What contour interval will I get?

The finest the state publishes at the lot. Queensland uses 1 m LiDAR where available, then 5 m, then 10 m SRTM. NSW, VIC, SA, WA and TAS use their own state sources. The ACT and the Northern Territory have no contours yet.

Do you cover my state?

The $29 Site Report is available in Queensland, New South Wales, Victoria, South Australia, Tasmania and the ACT. Design rainfall covers all of Australia; hazard overlays and DA history depend on what each state and council publishes.

Scope your next civil job with real levels.